Guest post written by Jim Arnold, National Director of Business Development, The Sports Facilities Companies.
Every so often, our industry goes through a recalibration of how sports tourism and recreations assets function and, in-turn, are funded. Pre-Recession (2008), a vast majority of sports tournaments were hosted by park and recreation assets within a community. Coming out of the recession, we began to see sport-specific destination complexes being developed to capture increased spending and travel impact. The next shift brought us to where we are today, with dynamic, flexible multi-sport facilities that can accommodate larger varieties of programming without overburdening communities with large debt.
Coming out of the pandemic, we are seeing the next evolution of sports facilities take place as communities focus on creating economic impact and spurring development while simultaneously providing a 24/7/365 asset for residents. The days of residents using a venue on Monday through Thursday, then stepping aside for weekend tournaments are quickly becoming a thing of the past.
I received a call last week from a potential client. Within the first few minutes, I learned they had 40 acres, a development partner, and $30 million worth of allocated funds. They understood the economic impact of the facility, the room night generation projection, and had even run a calculation of the value of the hours that the developer was dedicating to local use. This was one of the best starts to a sales call you could ask for. Then came the “but.”
“We understand all of this, BUT….help us understand what else this facility will do for our community so we can sell it to our residents.”
What a powerful question!
Before COVID-19, chances are, room night or direct spending calculations alone would have moved this project forward. Throw in the local use allocation promise and we’d be one step closer to putting a shovel in the ground. Not anymore.
So, what spurred this change? One immediate reason is that sports complexes cost more than ever. Increased costs along with the public’s dramatically increasing demand for recreational spaces has driven increased scrutiny of project funding, venue programming, and facility access. To justify the development of new complexes or investment in existing facilities, you need to be ready and able to quantify return on investment for communities beyond traditional impact metrics.
The infographic below is from the Aspen Institute. It perfectly defines why I am so passionate about our industry and why it’s so critical to building and sustaining communities.
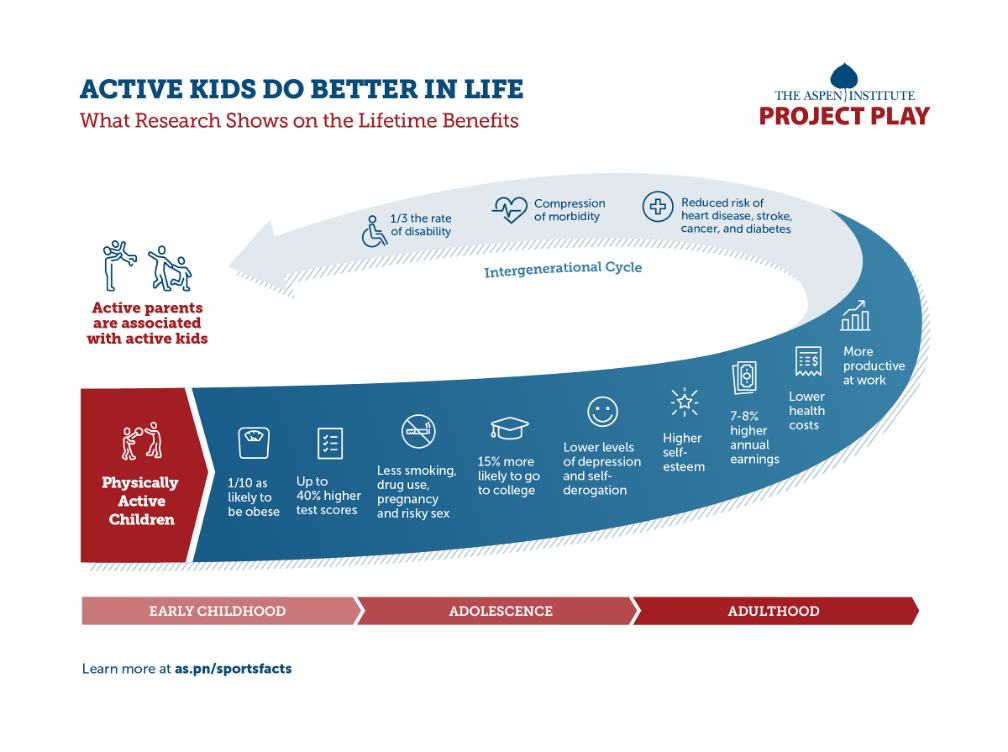
“Active kids do better in life.”1
The infographic indicates that the rate of disability and risk of morbidity, heart disease, stroke, cancer and diabetes for active kids is a third less than that of non-active kids. While this is an incredible and visual statistic, it doesn’t quite illustrate the impact of sports at a ground level. To do that, we turn to a morbidity and mortality report from the Centers for Disease Control and Prevention.
“1 in 4 adults has a disability that impacts major life activities.”2
This is a real problem in our communities and for our health systems currently. This statement helps us better understand a deep issue and how it can be resolved with the help of venues that promote an active lifestyle. With data supporting the issues and the solution, we’ve developed a formula to further clarify the impact of sports complexes and recreation facilities.
Let’s say Community A has 1,500 school age kids under the age of 18. Based on CDC research, there is a high likelihood that 25 percent of these kids will develop a disability that will impact their adult life. We also know that being active in sports and recreation reduces this risk by 33 percent.
1,500 kids multiplied by 25% (.25) = 375 kids with potential future disabilities due to a lack of proper recreation opportunities. Multiply that by 33% (.33) for a reduction to 124 kids with potential future disabilities if they receive access to recreation.
By creating equitable recreational and sports access and creating programs to engage youth in schools, Community A can potentially keep 251 of their current school-aged children from developing life-altering disabilities as an adult (375 to 124). This number would likely grow each year that a facility is open and as new classes of students participate in recreation programming.
Here are four other areas that communities can examine when assessing the value of new sports tourism and recreation complexes:
Development
Development has always been one of the key benefits of sports facilities. I often see people pitch this in the process, but rarely do facilities track it. This makes it difficult for youth sports facility operators to prove their impact when looking to expand or make capital improvements.
Tracking Solution:
As a solution, create mileage rings around the facility and track property sales, new business development and square footage lease rates. This information is readily available – and comes down to taking the time to gather and record the data.
Health & Medical Costs
Health and medical costs are a focal point for communities around the country – of particular concern are long-term medical costs for retired employees. According to the Pew Charitable Trust, local government health plans for retirees are only 6 percent funded3. A vast majority of communities are paying for these costs out of their annual budgets with no long-term plan for how to address if revenues fall short.
Tracking Solution:
As part of the programming for the facility, create membership or activation opportunities for public employees. Track activation of these programs as well as the ages in which employees begin their involvement. People who start to exercise before or during their middle age typically save from $824 to $1,874 annually on health care costs after retirement4. By tracking age and participation in physical activities on an annual basis, you can create a calculation that places a value on compounding retirement savings for your community.
Crime
Over the course of my career, I have developed facilities in some of the roughest areas in the roughest cities in the country. These facilities have proven time and time again to create safe havens and reduce crime in the surrounding areas. Prioritizing sports and recreation programs in communities can reduce total arrests by 28 – 35 percent, decrease violent crime by 45 – 50 percent, and lower readmissions in the criminal justice system by 21 percent.5
Tracking Solution
If you are a community struggling with crime in certain areas, it is important to stress equitable access to sports and the presence of at-risk youth programming. Create relationships with the police department early and work together to develop ways to track these statistics in selected radiuses around your facility. You can track community-wide numbers, as well as focus on radius rings and areas near schools that participate facility programs.
Graduation Rates
According to US News & World Report, current high school graduation rates in the United States are 88.6 percent.6 The Aspen Institute’s Project Play has provided data indicating that kids who play athletics are 15 percent more likely to graduate and go to college. Yet, fewer than 4 in 10 students play sports in public high schools7 and only 23 percent get the recommended level of daily physical activity – down from 29% in 2011.8(1)
If a community is below the national or state average for high school graduation, creating, implementing, and tracking school programs within the facility can be an important and measurable factor.
Tracking Solution
Create a method of tracking program usage and look for correlations between year-over-year increases in participation and graduation rates.
In closing, there is not a “one size fits all” approach to calculating the return on investment for every sports facility. And we are entering a time in which non-traditional measures, such as the ability of a venue to drive job creation, housing values, and residential retention and growth, are becoming increasingly sought after. While traditional metrics such as economic impact and room nights will always be important, if you can create quantitative return on investment calculations around these non-traditional elements, you will provide the tools necessary to support your project.
Below are a few steps that can help you think about your approach if you are in the process of planning a new development, expansion or capital improvements.
- Identify the needs/factors that are most important to your community
- Create a formula/calculation for how you will quantify data.
- Put a plan in place for how you will gather, store, and report on data.
- Create a scorecard or reporting template that can be created to easily show ROI across all tracked categories.
- Be flexible in your approach. New and more sophisticated data continues to be discovered. Be prepared, and willing, to alter your variables and formulas.
At the Sports Facilities Companies, we help you build a legacy in your community by guiding you through every step and stage of the sports complex and recreation center development process. To learn more, contact us or call us today at 727-474-3845.
About Jim Arnold
Jim is widely recognized as one of the leading designers and developers of youth sports complexes in the nation. With nearly 20 years of experience in the industry, he has overseen the planning, design, development, and operations of many of the most innovative, successful and influential facilities in the country. For more information on this article or other topics/questions, you can contact Jim at: [email protected]
References:
- Aspen Institute – https://www.aspenprojectplay.org/youth-sports/facts
- Centers for Disease Control & Prevention – https://www.cdc.gov/mmwr/volumes/67/wr/mm6732a3.htm?s_cid=mm6732a3_w
- https://www.pewtrusts.org/~/media/legacy/uploadedfiles/pcs_assets/2013/Pewcitypensionsreportpdf.pdf
- BMJ Journals – https://bmjopensem.bmj.com/content/7/1/e001038#T2
- Sara B. Helleret al., “Thinking, Fast and Slow? Some Field Experiments to Reduce Crime and Dropout in Chicago” (working paper, NBER Working Paper Series, no. 21178, National Bureau of Economic Research, Cambridge, MA, revised 2016).
- S. News & World Report – https://www.usnews.com/education/best-high-schools/articles/see-high-school-graduation-rates-by-state
- Aspen Institute of Resonant Education Analysis of 2017 – 2018 High School Data
- Youth Risk Behavior Surveillance System, Centers for Disease Control and Prevention. https://www.cdc.gov/healthyyouth/data/yrbs/pdf/2019/su6901-H.pdf
- NRPA – 72% stat https://www.nrpa.org/globalassets/2020-engagement-report.pdf